OpenRepGrid: An R Package for the Analysis of Repertory Grid Data
Source:vignettes/web/intro.Rmd
intro.RmdThe OpenRepGrid R package is a software to analyze and visualize repertory grid (often abbreviated grid or repgrid) data. The software is open source and available on all major operating systems. The package is also the workhorse on which other packages of the OpenRepGrid project, for example, gridsampler (Heckmann & Burk, 2017) or OpenRepGrid.ic (Heckmann, Burr, & King, 2023), partially build upon.
Repertory Grid Technique
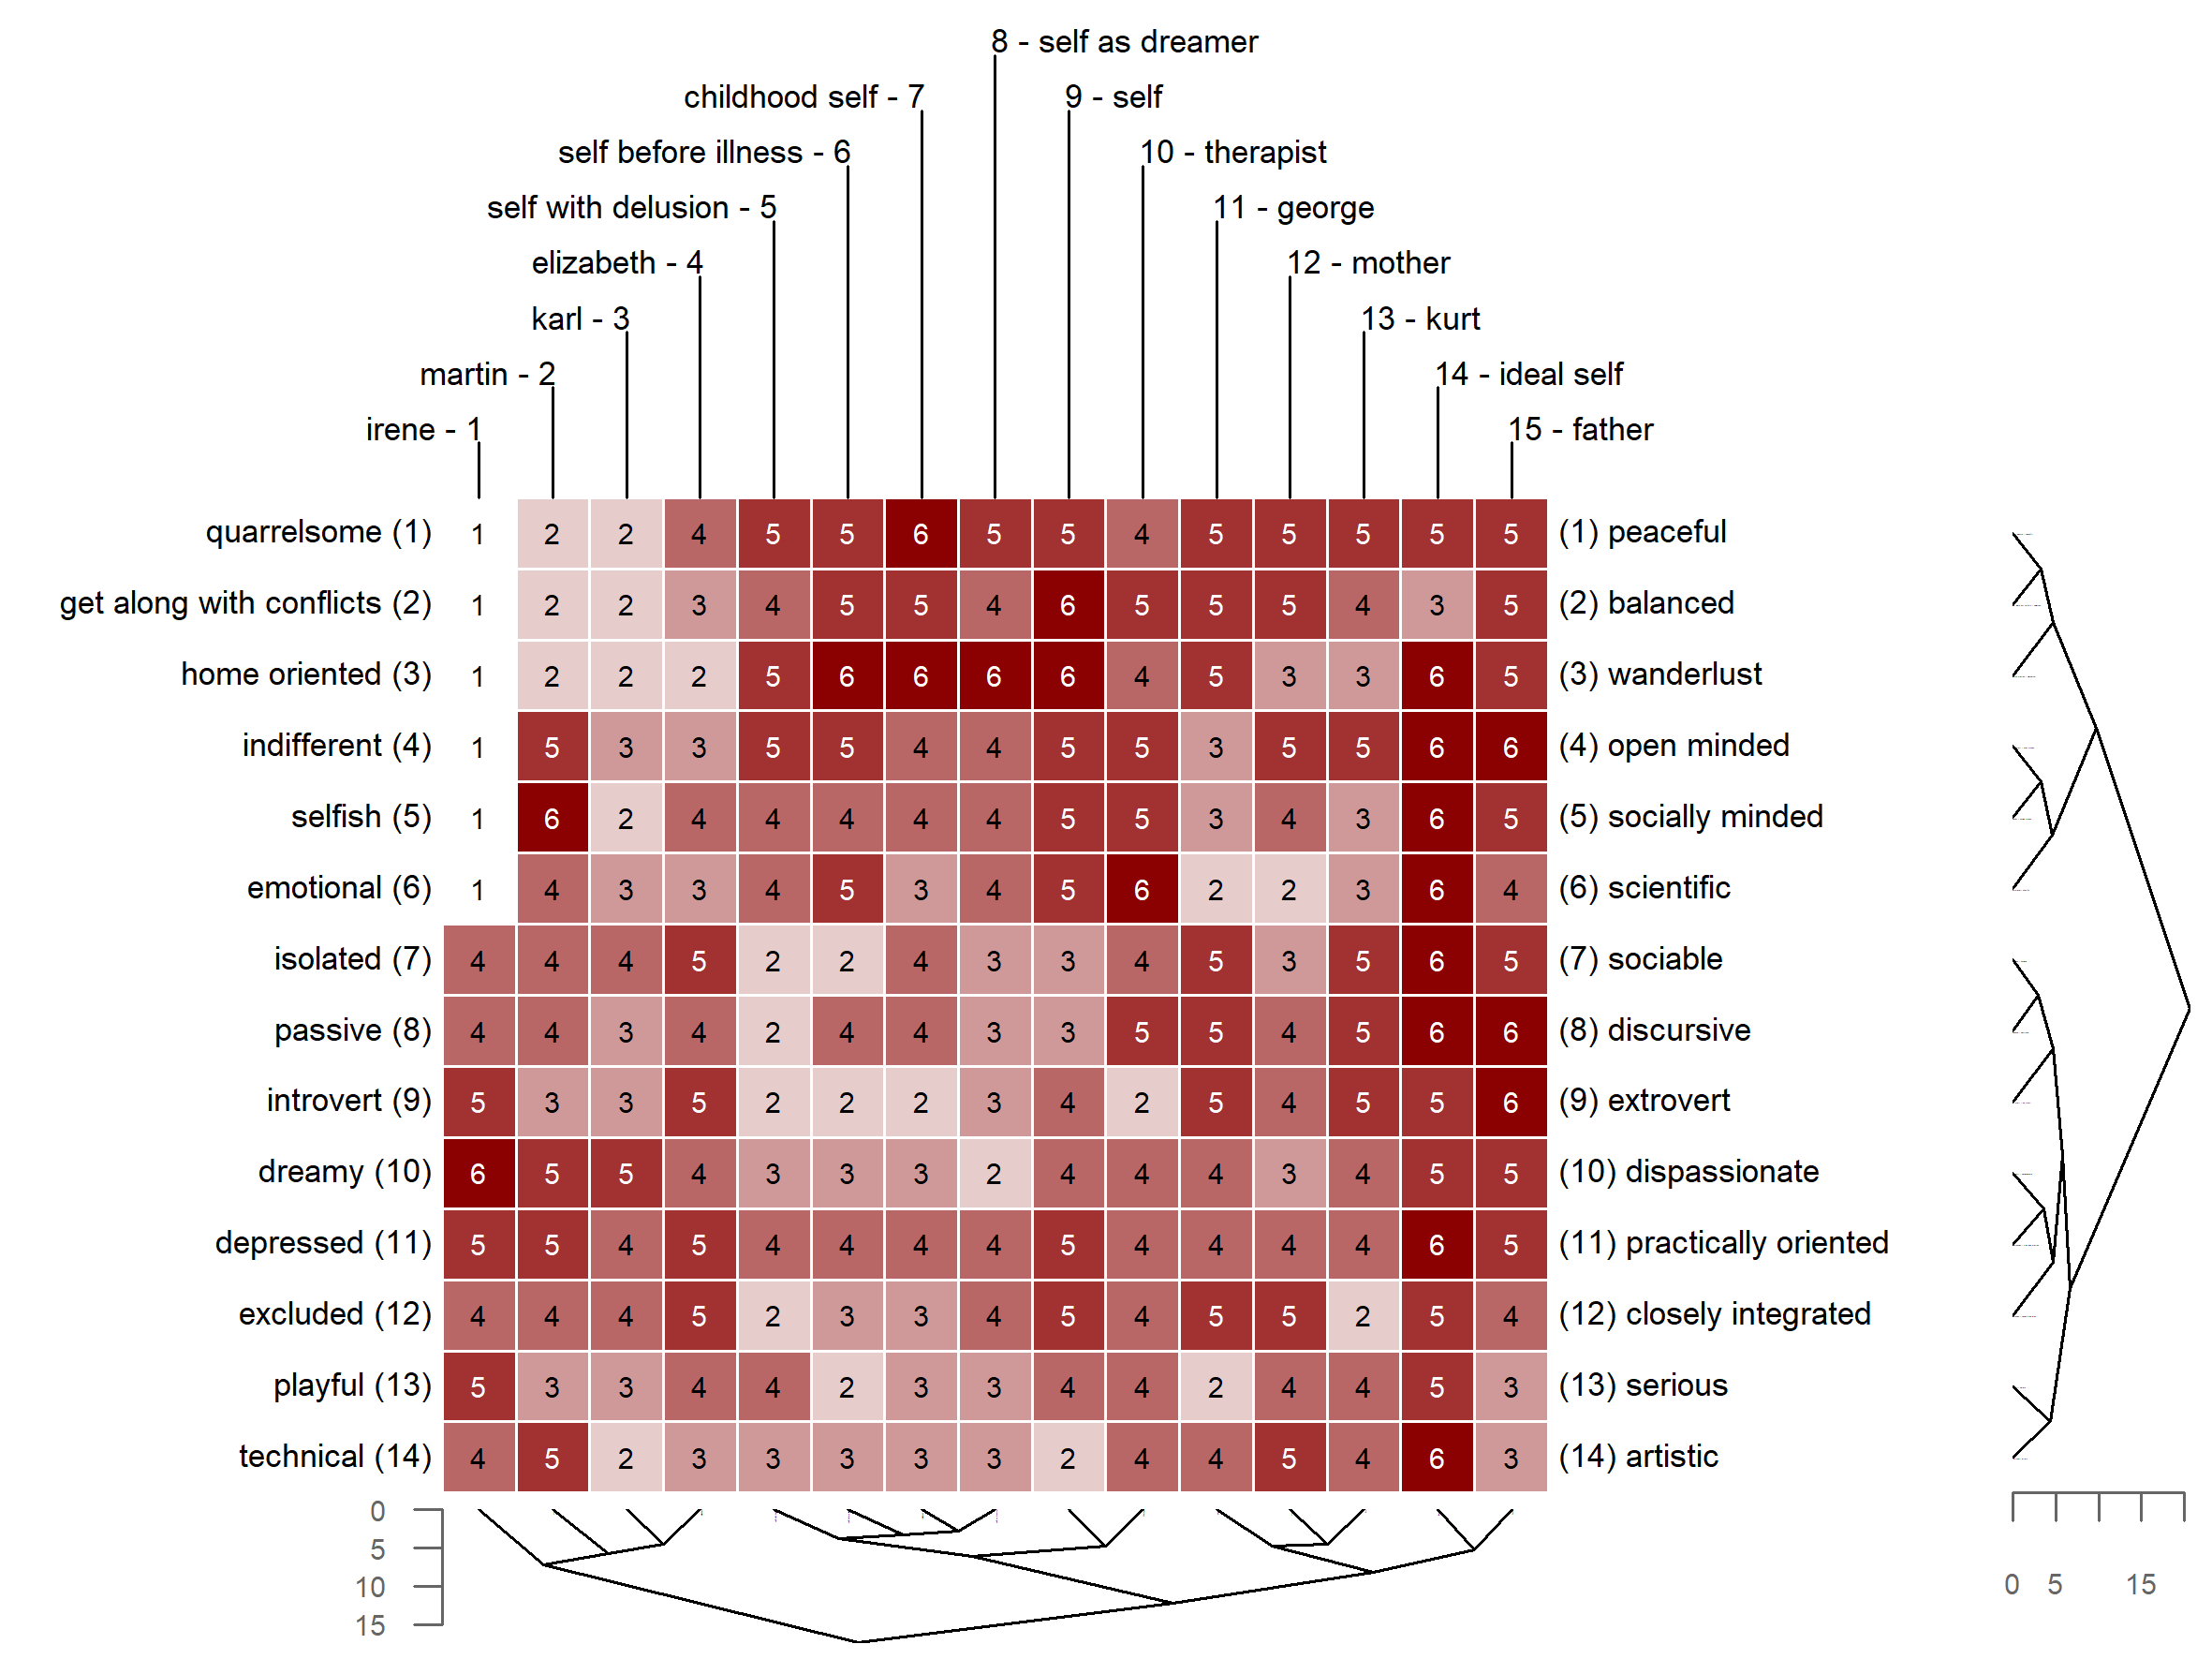
The repertory grid technique (RGT) is a data collection method which originated from Personal Construct Theory (PCT) (Kelly, 1955). It was originally designed as an instrument for psychotherapy to shed light on a client’s construction of the world. Over subsequent decades, the technique has been adopted in many other fields, including market, organizational, political, educational and sensory research (Fransella, Bell, & Bannister, 2004). The data the RGT generates is qualitative and quantitative. On the qualitative side, the technique elicits the repertory of bipolar attributes (e.g. smart vs. dull, so called constructs in PCT terminology) an individual uses to make distinctions between entities of the world (e.g. different people, so called elements in PCT terminolgy). On the quatitative side, it requires rating each element on each elicited personal construct (e.g. Martin gets a score of 2 on the quarrelsome = 1 vs. peaceful = 6 construct, indicating that Martin is quite quarrelsome). The result of the data collection procedure is a data matrix. The constructs are usually presented as matrix rows, the elements as columns and each cell contains the corresponding rating score. Figure 1 depicts a repertory grid data set, with the rows (constructs) and columns (elements) being clustered by similarity (see below for details). A thorough introduction to the repertory grid technique is given by Fransella et al. (2004).
Available Software
While it is possible to work with repertory grids directly without further processing, it is common to submit grid data to statistical or mathematical analysis (e.g. Fransella et al., 2004). For this purpose, software packages have been developed since the 1960s (Sewell, Adams-webber, Mitterer, & Cromwell, 1992). Today, several softwares are available on the market, e.g. Enquire Within (Mayes, 2008), GridStat (Bell, 2009), GridCor (Feixas & Cornejo, 2002), Idiogrid (Grice, 2002), Rep 5 (Gaines & Shaw, 2009), GridSuite (Fromm & Bacher, 2006), rep:grid (Rosenberger, 2015). Despite the numerous software packages being available, several issues are common among them:
- No grid software offers all methods of grid analysis that have been devised in the literature.
- None of the available grid programs can be extended by the user, i.e., the user cannot add or modify features. All listed softwares are closed source or at least not available in a public repository.
- There is no computational framework integrated into the available grid programs to support experimental types of analysis.
- The output of most grid analysis programs does not easily lend itself to subsequent computation.
- There is no joint community effort to improve a grid program: The development and documentation is delegated to the software providers, while users or researcher do usually not participate in this process.
- A lack of community participation in the software development and its closed source nature leads to the problem of discontinued development once its initiators have moved on or retired.
Rationale
The OpenRepGrid project was started with the idea of overcoming above mentioned issues. It was designed as an open source project allowing other researchers to contribute, for example, by implementing new features. R was chosen as the programming language as it runs on all major operating systems, gets increasingly popular among academics and is nowadays already taught to undergrads at many universities. The open source nature of R makes it transparent how functions (i.e. methods of grid analysis) are implemented. Also, R and most contributed packages are distributed under a copyleft license. This allows reseachers to use or modify existing code for their own needs and redistribute the code under the same license. In total, the obstancles to experimenting and contributing are significantly lowered compared to other softwares on the market.
The open source and collaborative stance of the project may bear another important benefit in terms of scientific progress. Currently, there appears to exist a substantial latency between publication of new grid analysis methods and them being made available to researchers as software features. For example, the structural quadrant method (SQM), a method to assess construct system complexity, devised over 20 years ago by Gallifa & Botella (2000), may serve as an example. The SQM has not been implemented in any grid program, hindering research and discussion of the method. The OpenRepGrid project may help to improve this situation. If researchers decide to build their new method in R from the beginning on, adding their method to the OpenRepGrid package will only be a small additional step. This will facilitate the dissemination of new methods in the research community, leading to a reduction in time-to-market for new methodological ideas. Once the method’s code has been tested and documented, it can immediately become part of the OpenRepGrid package and instantly be used by all researchers using grids.
Another reason for the choice of R is its growing ability to easily build graphical user interfaces (GUI) using, for example, the shiny (Chang, Cheng, Allaire, Xie, & McPherson, 2019) and other related R packages. The PCP community is on average not well-versed in programming. This translates into the need for easy to operate, GUI-based software. As shiny does not require knowledge of other web languages (i.e. CSS, HTML, JavaScript) to build a fully operational web application, R is also a suitable choice to fullfill this community need.
Features
An up-to-date overview of all features implemented in the OpenRepGrid package can be found on the project’s documentation site (http://docs.openrepgrid.org.) and in the R package’s documentation files, accessible via R Help. The implemented features include the following:
- Data handling: Importing and exporting grid data from different formats, sorting grids, several included datasets (e.g. the boeker dataset, see below)
- Analyzing constructs: Descriptive statistics, correlations, distances, PCA of construct correlations, cluster analysis, aligning constructs
- Analyzing elements: Descriptive statistics, correlations, distances, standardized element distances, cluster analysis
- Visualization: (Clustered) Bertin plots (i.e. heatmaps), biplots, clustering dendrograms
- Indexes: Intensity, complexity, PVAFF, measures of cognitive conflict, implicative dilemmas, etc.
In the remainder, three repgrid visualizations which are frequently used in publications and two types of statistical grid analyses are briefly outlined as feature examples. Figure 1 shows a Bertin diagram (i.e. heatmap) of a grid administered to a schizophrenic patient undergoing psychoanalytically oriented psychotherapy (Böker, 1996). The data was taken during the last stage of therapy. The data for this example is already included in the package. The ratings in the grid are color-coded allowing to spot similar rating patterns. Also, the grid was submitted to hierarchical cluster analysis, thereby reordering the constructs and elements by similarity as indicated by the dendrograms printed alongside the diagram. The following code creates the diagram shown in Figure 1.
Figure 2 shows a biplot of the grid data from Figure 1. A biplot is the generalization of a scatterplot from two to many axes, all displayed in a single plot. It allows reading off the approximate score of each element on each construct by projecting an element’s position in the plot on the construct axes (Greenacre, 2010; Slater, 1977). In the biplot, it can, for example, be seen that the “father” is the element construed most closely to the “ideal self”. Biplots of grid data are generally useful to generate transparency of the individual’s overall construction of the elements and their similarity. Figure 2 is created by the following code.
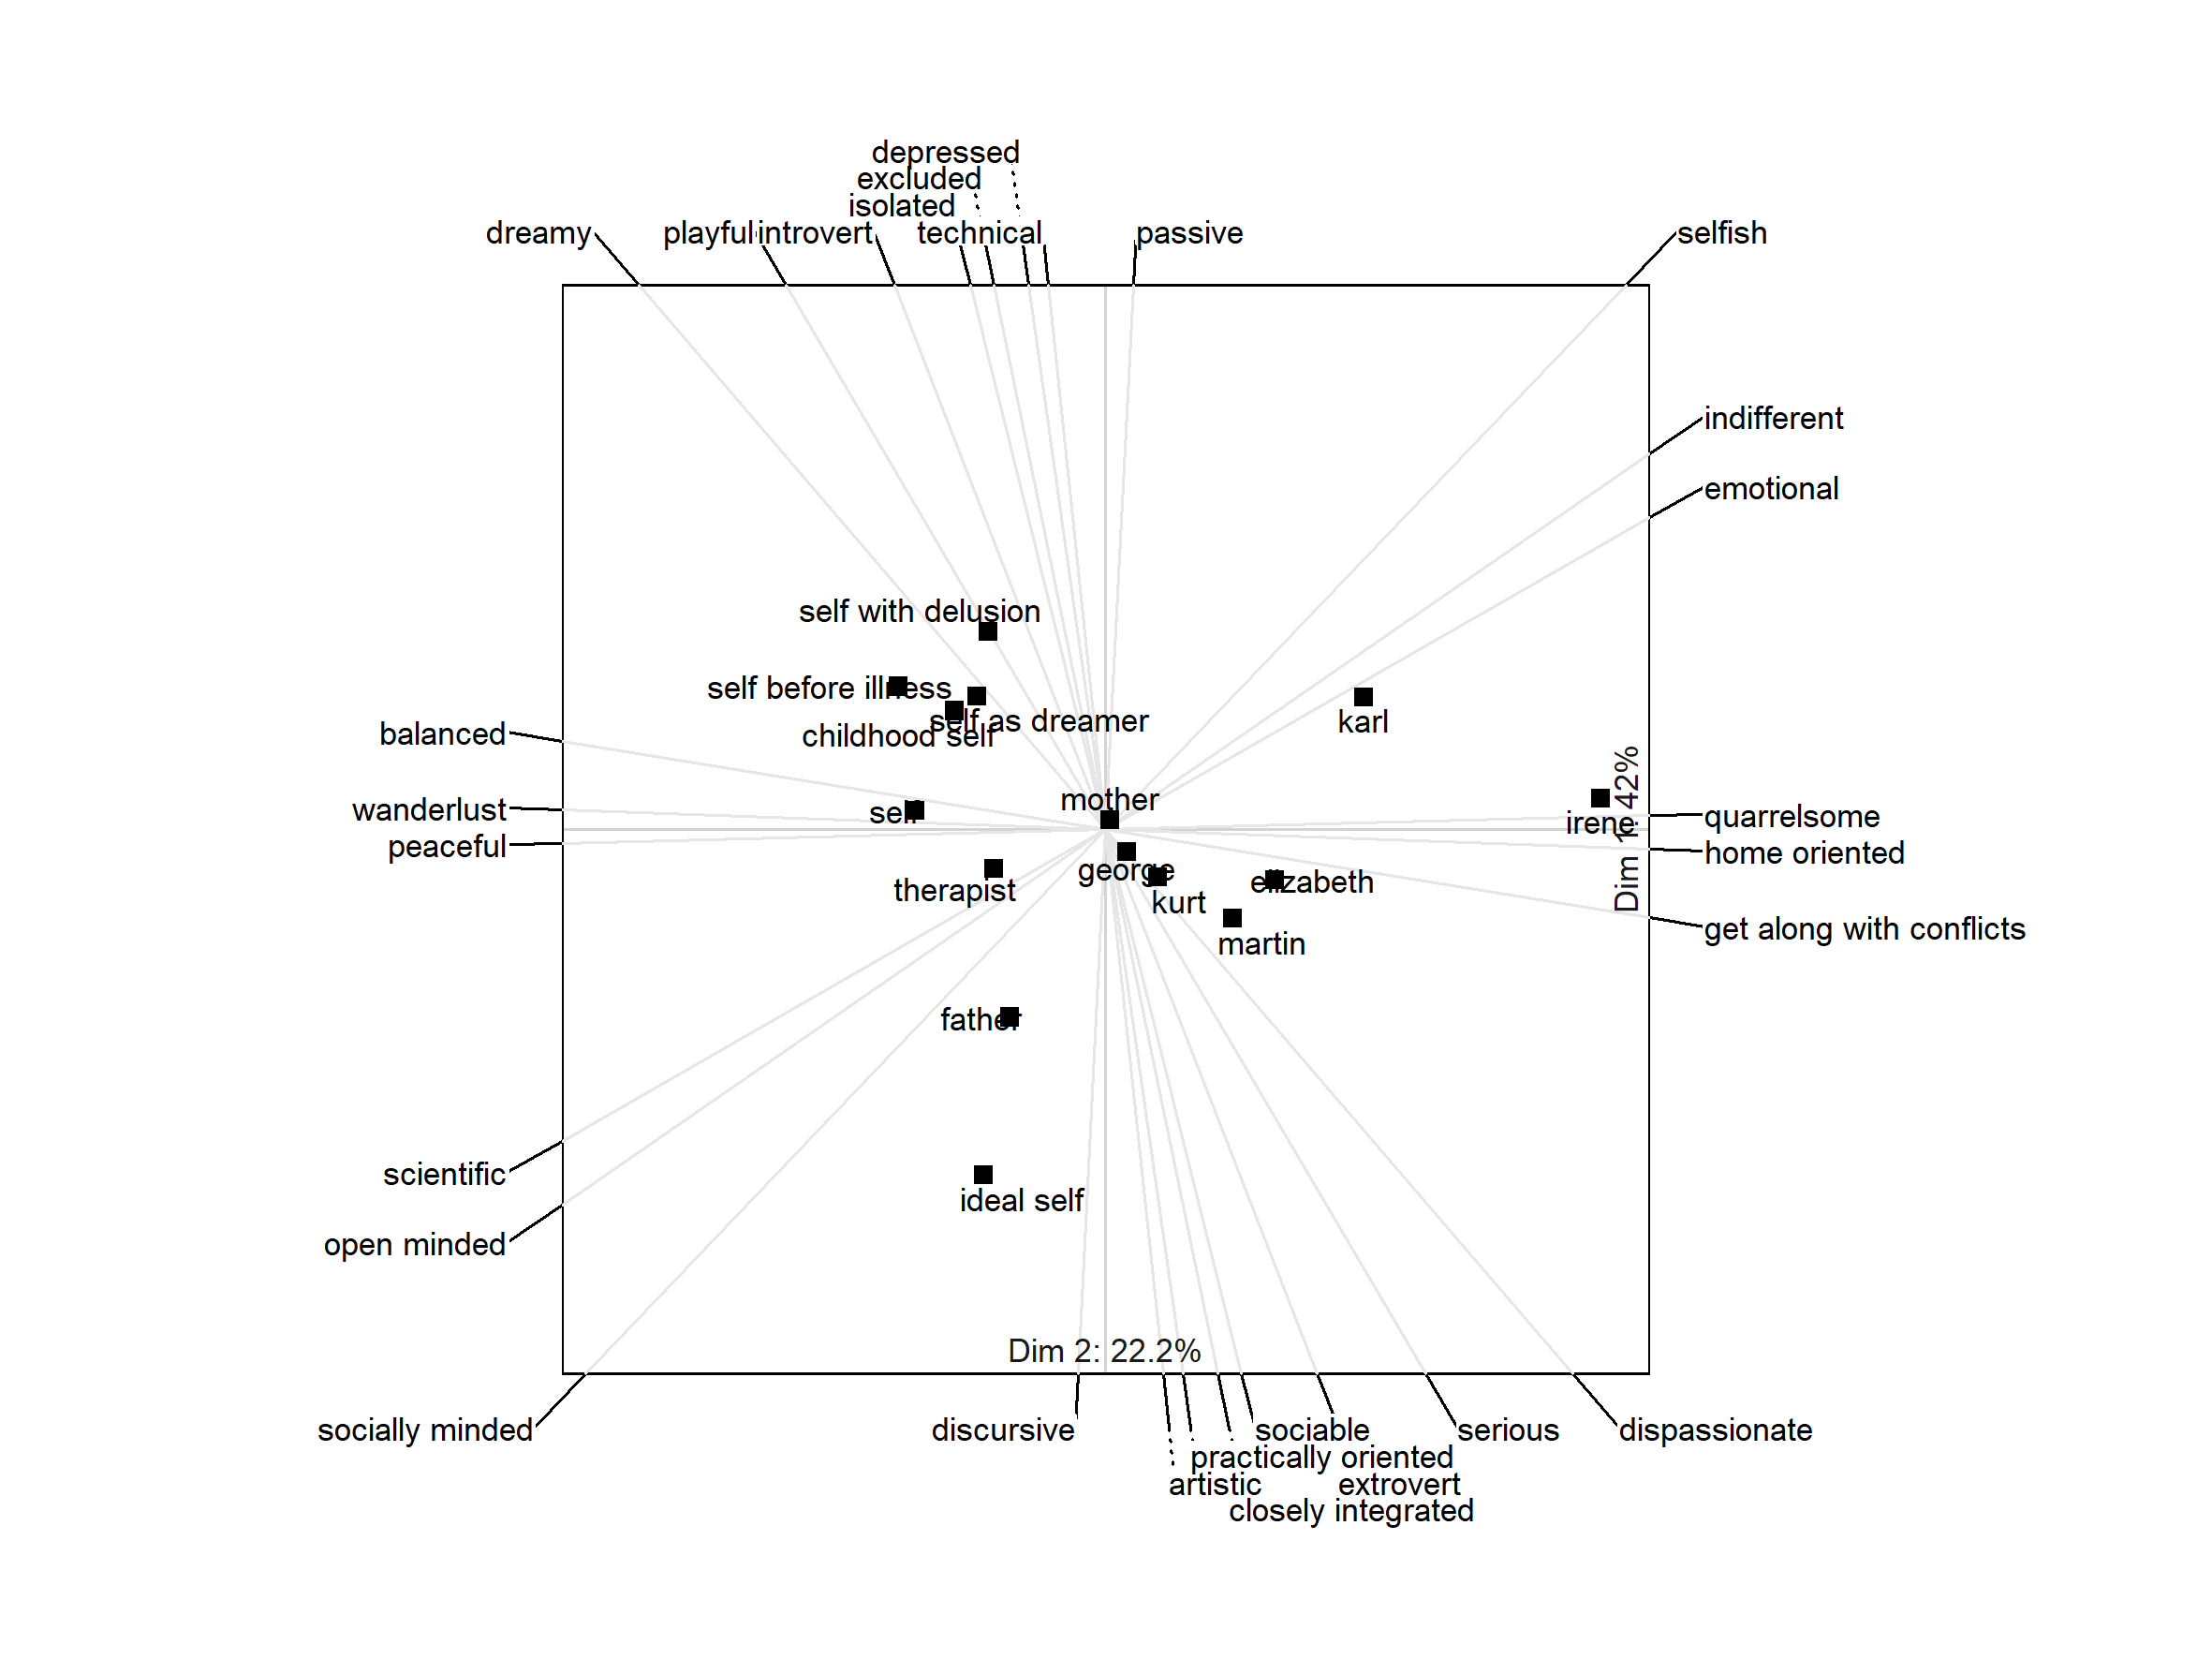
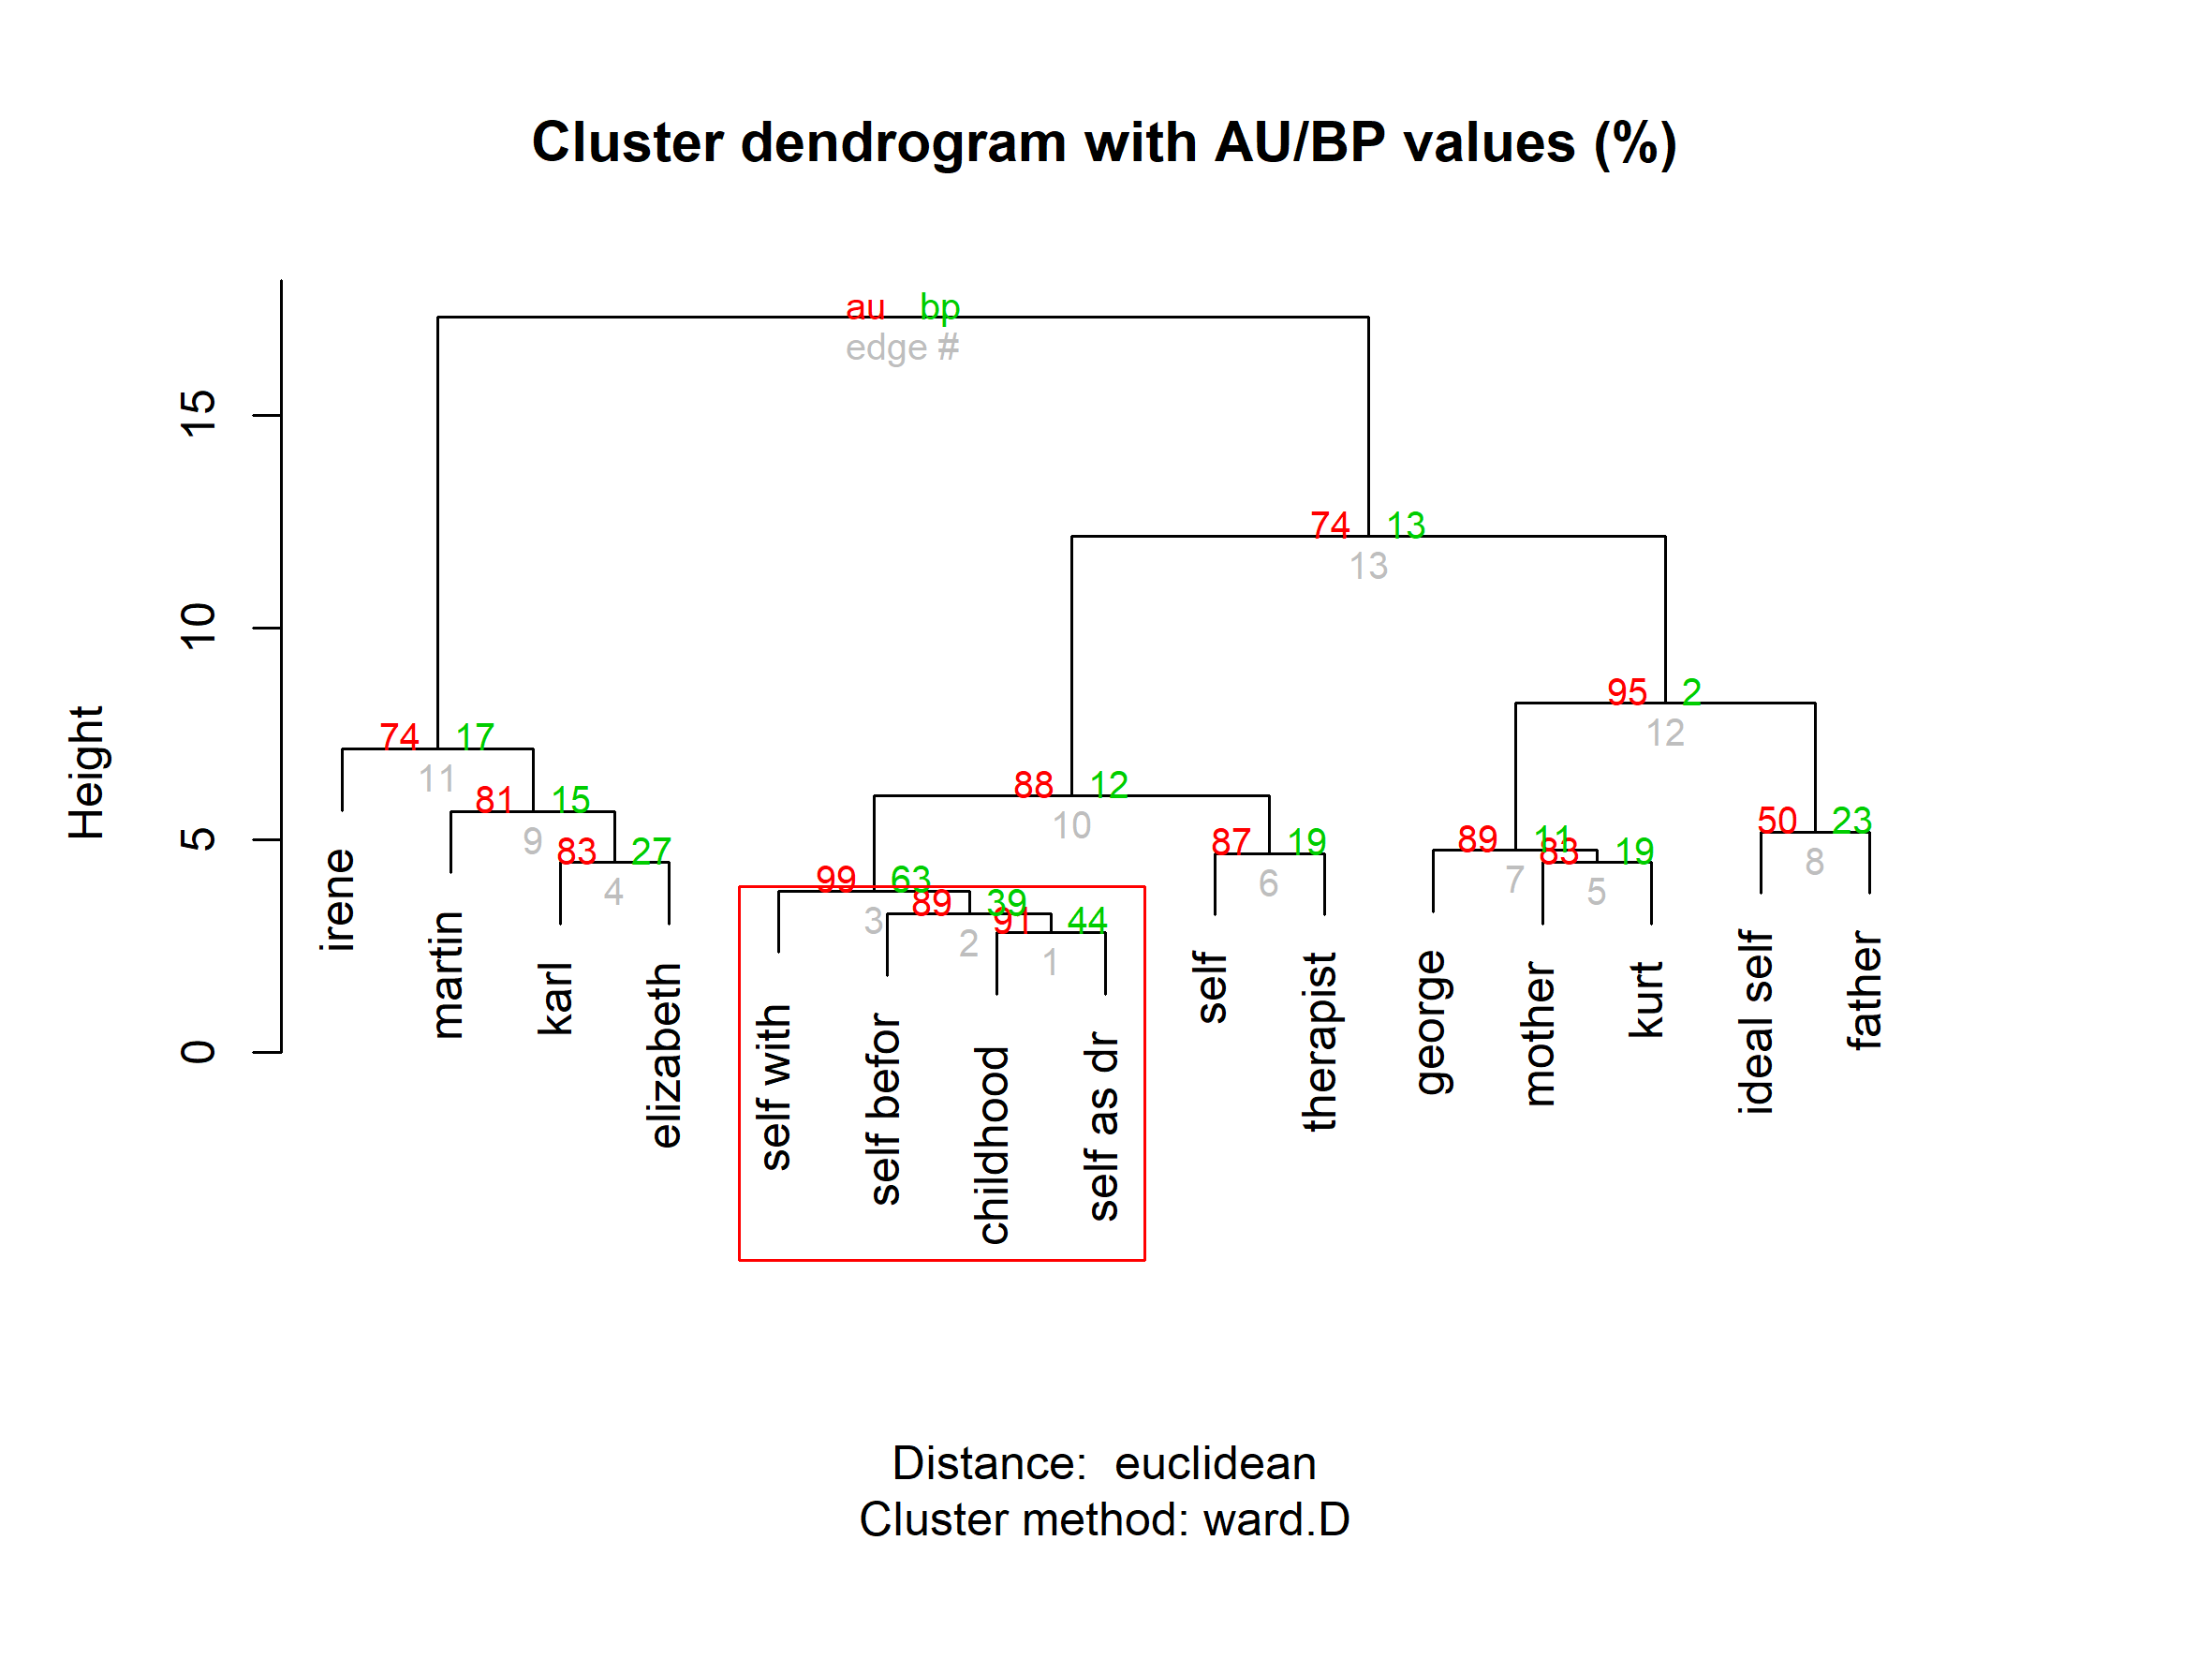
Figure 3 shows the dendrogram for the elements, here the result of a hierarchical cluster analysis using Ward’s method with a Euclidean distances measure. Using an approach suggested by Heckmann & Bell (2016), the dendrogram structures are also tested for stability. Stable or significant structures are framed in a rectangle, indicating that “childhood self”, “self before illness”, “self with delusion”, and “self as dreamer” forms a stable group of elements. Figure 3 is created by the following code.
Inter-element distances are a commonly applied measure in the statistical analysis of grid data (Fransella et al., 2004). As already shown in the biplot example above, distances between elements indicate which elements (i.e. persons) are construed as similar. One distance of particular intererest in psychotherapy research is the self-ideal distance as it may provide useful clinical indications (e.g. Taylor, Usher, Jomar, & Forrester, 2020). But also in other areas, for example, in market research element distances are frequently used in the analysis (e.g. Hauser, Jonas, & Riemann, 2011). In most cases, the Euclidean distance is selected as a distance measure. As the maximal Euclidean distances between two elements depends on the rating scale and the number of constructs in a grid, several approaches to standardizing inter-element distances have been suggested. One well known approach which has come to be known as Slater distances, divides the inter-element distance by its expected value (Slater, 1977). However, Hartmann (1992) showed in a simulation study that Slater distances have a skewed distribution, as well as a mean and a standard deviation depending on the number of elicited constructs. Hartmann suggested an improvement measure by applying a transformation to standardize Slater distances across different grid sizes. This development serves as another example of above mentioned situation, as to the best of my knowledge, Hartmann distances are currently only implemented in OpenRepGrid and no other grid software. Hartmann distances can be calculated using the following code.
distanceHartmann(boeker)
# | | | 0% | |= | 0% | |= | 1% | |== | 1% | |=== | 1% | |=== | 2% | |==== | 2% | |===== | 2% | |===== | 3% | |====== | 3% | |======= | 3% | |======= | 4% | |======== | 4% | |========= | 4% | |========= | 5% | |========== | 5% | |========== | 6% | |=========== | 6% | |============ | 6% | |============ | 7% | |============= | 7% | |============== | 7% | |============== | 8% | |=============== | 8% | |================ | 8% | |================ | 9% | |================= | 9% | |================== | 9% | |================== | 10% | |=================== | 10% | |==================== | 10% | |==================== | 11% | |===================== | 11% | |====================== | 11% | |====================== | 12% | |======================= | 12% | |======================== | 12% | |======================== | 13% | |========================= | 13% | |========================== | 13% | |========================== | 14% | |=========================== | 14% | |============================ | 14% | |============================ | 15% | |============================= | 15% | |============================= | 16% | |============================== | 16% | |=============================== | 16% | |=============================== | 17% | |================================ | 17% | |================================= | 17% | |================================= | 18% | |================================== | 18% | |=================================== | 18% | |=================================== | 19% | |==================================== | 19% | |===================================== | 19% | |===================================== | 20% | |====================================== | 20% | |======================================= | 20% | |======================================= | 21% | |======================================== | 21% | |========================================= | 21% | |========================================= | 22% | |========================================== | 22% | |=========================================== | 22% | |=========================================== | 23% | |============================================ | 23% | |============================================= | 23% | |============================================= | 24% | |============================================== | 24% | |=============================================== | 24% | |=============================================== | 25% | |================================================ | 25% | |================================================ | 26% | |================================================= | 26% | |================================================== | 26% | |================================================== | 27% | |=================================================== | 27% | |==================================================== | 27% | |==================================================== | 28% | |===================================================== | 28% | |====================================================== | 28% | |====================================================== | 29% | |======================================================= | 29% | |======================================================== | 29% | |======================================================== | 30% | |========================================================= | 30% | |========================================================== | 30% | |========================================================== | 31% | |=========================================================== | 31% | |============================================================ | 31% | |============================================================ | 32% | |============================================================= | 32% | |============================================================== | 32% | |============================================================== | 33% | |=============================================================== | 33% | |================================================================ | 33% | |================================================================ | 34% | |================================================================= | 34% | |================================================================== | 34% | |================================================================== | 35% | |=================================================================== | 35% | |=================================================================== | 36% | |==================================================================== | 36% | |===================================================================== | 36% | |===================================================================== | 37% | |====================================================================== | 37% | |======================================================================= | 37% | |======================================================================= | 38% | |======================================================================== | 38% | |========================================================================= | 38% | |========================================================================= | 39% | |========================================================================== | 39% | |=========================================================================== | 39% | |=========================================================================== | 40% | |============================================================================ | 40% | |============================================================================= | 40% | |============================================================================= | 41% | |============================================================================== | 41% | |=============================================================================== | 41% | |=============================================================================== | 42% | |================================================================================ | 42% | |================================================================================= | 42% | |================================================================================= | 43% | |================================================================================== | 43% | |=================================================================================== | 43% | |=================================================================================== | 44% | |==================================================================================== | 44% | |===================================================================================== | 44% | |===================================================================================== | 45% | |====================================================================================== | 45% | |====================================================================================== | 46% | |======================================================================================= | 46% | |======================================================================================== | 46% | |======================================================================================== | 47% | |========================================================================================= | 47% | |========================================================================================== | 47% | |========================================================================================== | 48% | |=========================================================================================== | 48% | |============================================================================================ | 48% | |============================================================================================ | 49% | |============================================================================================= | 49% | |============================================================================================== | 49% | |============================================================================================== | 50% | |=============================================================================================== | 50% | |================================================================================================ | 50% | |================================================================================================ | 51% | |================================================================================================= | 51% | |================================================================================================== | 51% | |================================================================================================== | 52% | |=================================================================================================== | 52% | |==================================================================================================== | 52% | |==================================================================================================== | 53% | |===================================================================================================== | 53% | |====================================================================================================== | 53% | |====================================================================================================== | 54% | |======================================================================================================= | 54% | |======================================================================================================== | 54% | |======================================================================================================== | 55% | |========================================================================================================= | 55% | |========================================================================================================= | 56% | |========================================================================================================== | 56% | |=========================================================================================================== | 56% | |=========================================================================================================== | 57% | |============================================================================================================ | 57% | |============================================================================================================= | 57% | |============================================================================================================= | 58% | |============================================================================================================== | 58% | |=============================================================================================================== | 58% | |=============================================================================================================== | 59% | |================================================================================================================ | 59% | |================================================================================================================= | 59% | |================================================================================================================= | 60% | |================================================================================================================== | 60% | |=================================================================================================================== | 60% | |=================================================================================================================== | 61% | |==================================================================================================================== | 61% | |===================================================================================================================== | 61% | |===================================================================================================================== | 62% | |====================================================================================================================== | 62% | |======================================================================================================================= | 62% | |======================================================================================================================= | 63% | |======================================================================================================================== | 63% | |========================================================================================================================= | 63% | |========================================================================================================================= | 64% | |========================================================================================================================== | 64% | |=========================================================================================================================== | 64% | |=========================================================================================================================== | 65% | |============================================================================================================================ | 65% | |============================================================================================================================ | 66% | |============================================================================================================================= | 66% | |============================================================================================================================== | 66% | |============================================================================================================================== | 67% | |=============================================================================================================================== | 67% | |================================================================================================================================ | 67% | |================================================================================================================================ | 68% | |================================================================================================================================= | 68% | |================================================================================================================================== | 68% | |================================================================================================================================== | 69% | |=================================================================================================================================== | 69% | |==================================================================================================================================== | 69% | |==================================================================================================================================== | 70% | |===================================================================================================================================== | 70% | |====================================================================================================================================== | 70% | |====================================================================================================================================== | 71% | |======================================================================================================================================= | 71% | |======================================================================================================================================== | 71% | |======================================================================================================================================== | 72% | |========================================================================================================================================= | 72% | |========================================================================================================================================== | 72% | |========================================================================================================================================== | 73% | |=========================================================================================================================================== | 73% | |============================================================================================================================================ | 73% | |============================================================================================================================================ | 74% | |============================================================================================================================================= | 74% | |============================================================================================================================================== | 74% | |============================================================================================================================================== | 75% | |=============================================================================================================================================== | 75% | |=============================================================================================================================================== | 76% | |================================================================================================================================================ | 76% | |================================================================================================================================================= | 76% | |================================================================================================================================================= | 77% | |================================================================================================================================================== | 77% | |=================================================================================================================================================== | 77% | |=================================================================================================================================================== | 78% | |==================================================================================================================================================== | 78% | |===================================================================================================================================================== | 78% | |===================================================================================================================================================== | 79% | |====================================================================================================================================================== | 79% | |======================================================================================================================================================= | 79% | |======================================================================================================================================================= | 80% | |======================================================================================================================================================== | 80% | |========================================================================================================================================================= | 80% | |========================================================================================================================================================= | 81% | |========================================================================================================================================================== | 81% | |=========================================================================================================================================================== | 81% | |=========================================================================================================================================================== | 82% | |============================================================================================================================================================ | 82% | |============================================================================================================================================================= | 82% | |============================================================================================================================================================= | 83% | |============================================================================================================================================================== | 83% | |=============================================================================================================================================================== | 83% | |=============================================================================================================================================================== | 84% | |================================================================================================================================================================ | 84% | |================================================================================================================================================================= | 84% | |================================================================================================================================================================= | 85% | |================================================================================================================================================================== | 85% | |================================================================================================================================================================== | 86% | |=================================================================================================================================================================== | 86% | |==================================================================================================================================================================== | 86% | |==================================================================================================================================================================== | 87% | |===================================================================================================================================================================== | 87% | |====================================================================================================================================================================== | 87% | |====================================================================================================================================================================== | 88% | |======================================================================================================================================================================= | 88% | |======================================================================================================================================================================== | 88% | |======================================================================================================================================================================== | 89% | |========================================================================================================================================================================= | 89% | |========================================================================================================================================================================== | 89% | |========================================================================================================================================================================== | 90% | |=========================================================================================================================================================================== | 90% | |============================================================================================================================================================================ | 90% | |============================================================================================================================================================================ | 91% | |============================================================================================================================================================================= | 91% | |============================================================================================================================================================================== | 91% | |============================================================================================================================================================================== | 92% | |=============================================================================================================================================================================== | 92% | |================================================================================================================================================================================ | 92% | |================================================================================================================================================================================ | 93% | |================================================================================================================================================================================= | 93% | |================================================================================================================================================================================== | 93% | |================================================================================================================================================================================== | 94% | |=================================================================================================================================================================================== | 94% | |==================================================================================================================================================================================== | 94% | |==================================================================================================================================================================================== | 95% | |===================================================================================================================================================================================== | 95% | |===================================================================================================================================================================================== | 96% | |====================================================================================================================================================================================== | 96% | |======================================================================================================================================================================================= | 96% | |======================================================================================================================================================================================= | 97% | |======================================================================================================================================================================================== | 97% | |========================================================================================================================================================================================= | 97% | |========================================================================================================================================================================================= | 98% | |========================================================================================================================================================================================== | 98% | |=========================================================================================================================================================================================== | 98% | |=========================================================================================================================================================================================== | 99% | |============================================================================================================================================================================================ | 99% | |============================================================================================================================================================================================= | 99% | |============================================================================================================================================================================================= | 100% | |==============================================================================================================================================================================================| 100%
#
# ##########################
# Distances between elements
# ##########################
#
# Distance method: Hartmann (standardized Slater distances)
# Normalized:
# 1 2 3 4 5 6 7 8 9 10 11 12 13 14 15
# (1) self 1 -0.28 1.56 1.90 0.79 -1.32 1.19 -0.29 -0.04 2.60 -5.20 2.63 2.84 2.26 2.87
# (2) ideal self 2 -0.77 1.35 -0.47 -2.08 -0.56 0.12 -1.01 0.12 -3.66 -1.49 -1.44 -1.62 -1.70
# (3) mother 3 1.68 2.97 0.22 2.80 1.14 2.25 2.08 -3.81 1.90 1.05 1.43 1.90
# (4) father 4 2.29 -1.04 2.21 0.54 0.99 1.91 -4.36 0.95 0.49 0.08 0.62
# (5) kurt 5 0.63 2.70 1.26 2.67 1.72 -3.35 1.29 0.35 0.78 1.00
# (6) karl 6 0.28 1.62 2.12 -0.65 0.10 -1.20 -1.52 -0.59 -1.04
# (7) george 7 0.44 2.17 1.16 -3.37 1.68 0.53 0.42 1.34
# (8) martin 8 2.02 1.21 -1.83 -0.67 -0.73 -0.13 -0.53
# (9) elizabeth 9 0.75 -2.05 -0.08 -0.90 -0.28 0.05
# (10) therapist 10 -4.87 2.18 2.33 1.95 2.20
# (11) irene 11 -5.43 -5.60 -4.75 -5.48
# (12) childhood self 12 3.63 3.13 4.19
# (13) self before illness 13 3.57 3.76
# (14) self with delusion 14 3.49
# (15) self as dreamer 15The last feature example concers the detection of implicative
dilemmas. Implicative dilemmas represent a form of cognitive conflict.
An implicative dilemma arises when a desired change on one construct is
associated with an undesired change on another construct. For example, a
timid person may wish to become more socially skilled
but associates being more socially skilled with several negative
characteristics (selfish, insensitive etc.). The person might, for
example, construe the implication of becoming less timid (desired) as
becoming more selfish (undesired) at the same time (Winter, 1982). As a consequence, the person may
resist to the desired change if the presumed implications will threaten
the person’s identity and the predictive power of his construct system.
The investigation of the role of implicative dilemmas in different
mental disorders is an active field of research in Personal Construct
Psychology (Dorough, Grice, & Parker, 2007;
e.g. Feixas & Saúl, 2004; Rouco, Paz, Winter, & Feixas,
2019). Implicative dilemma can be detected using the
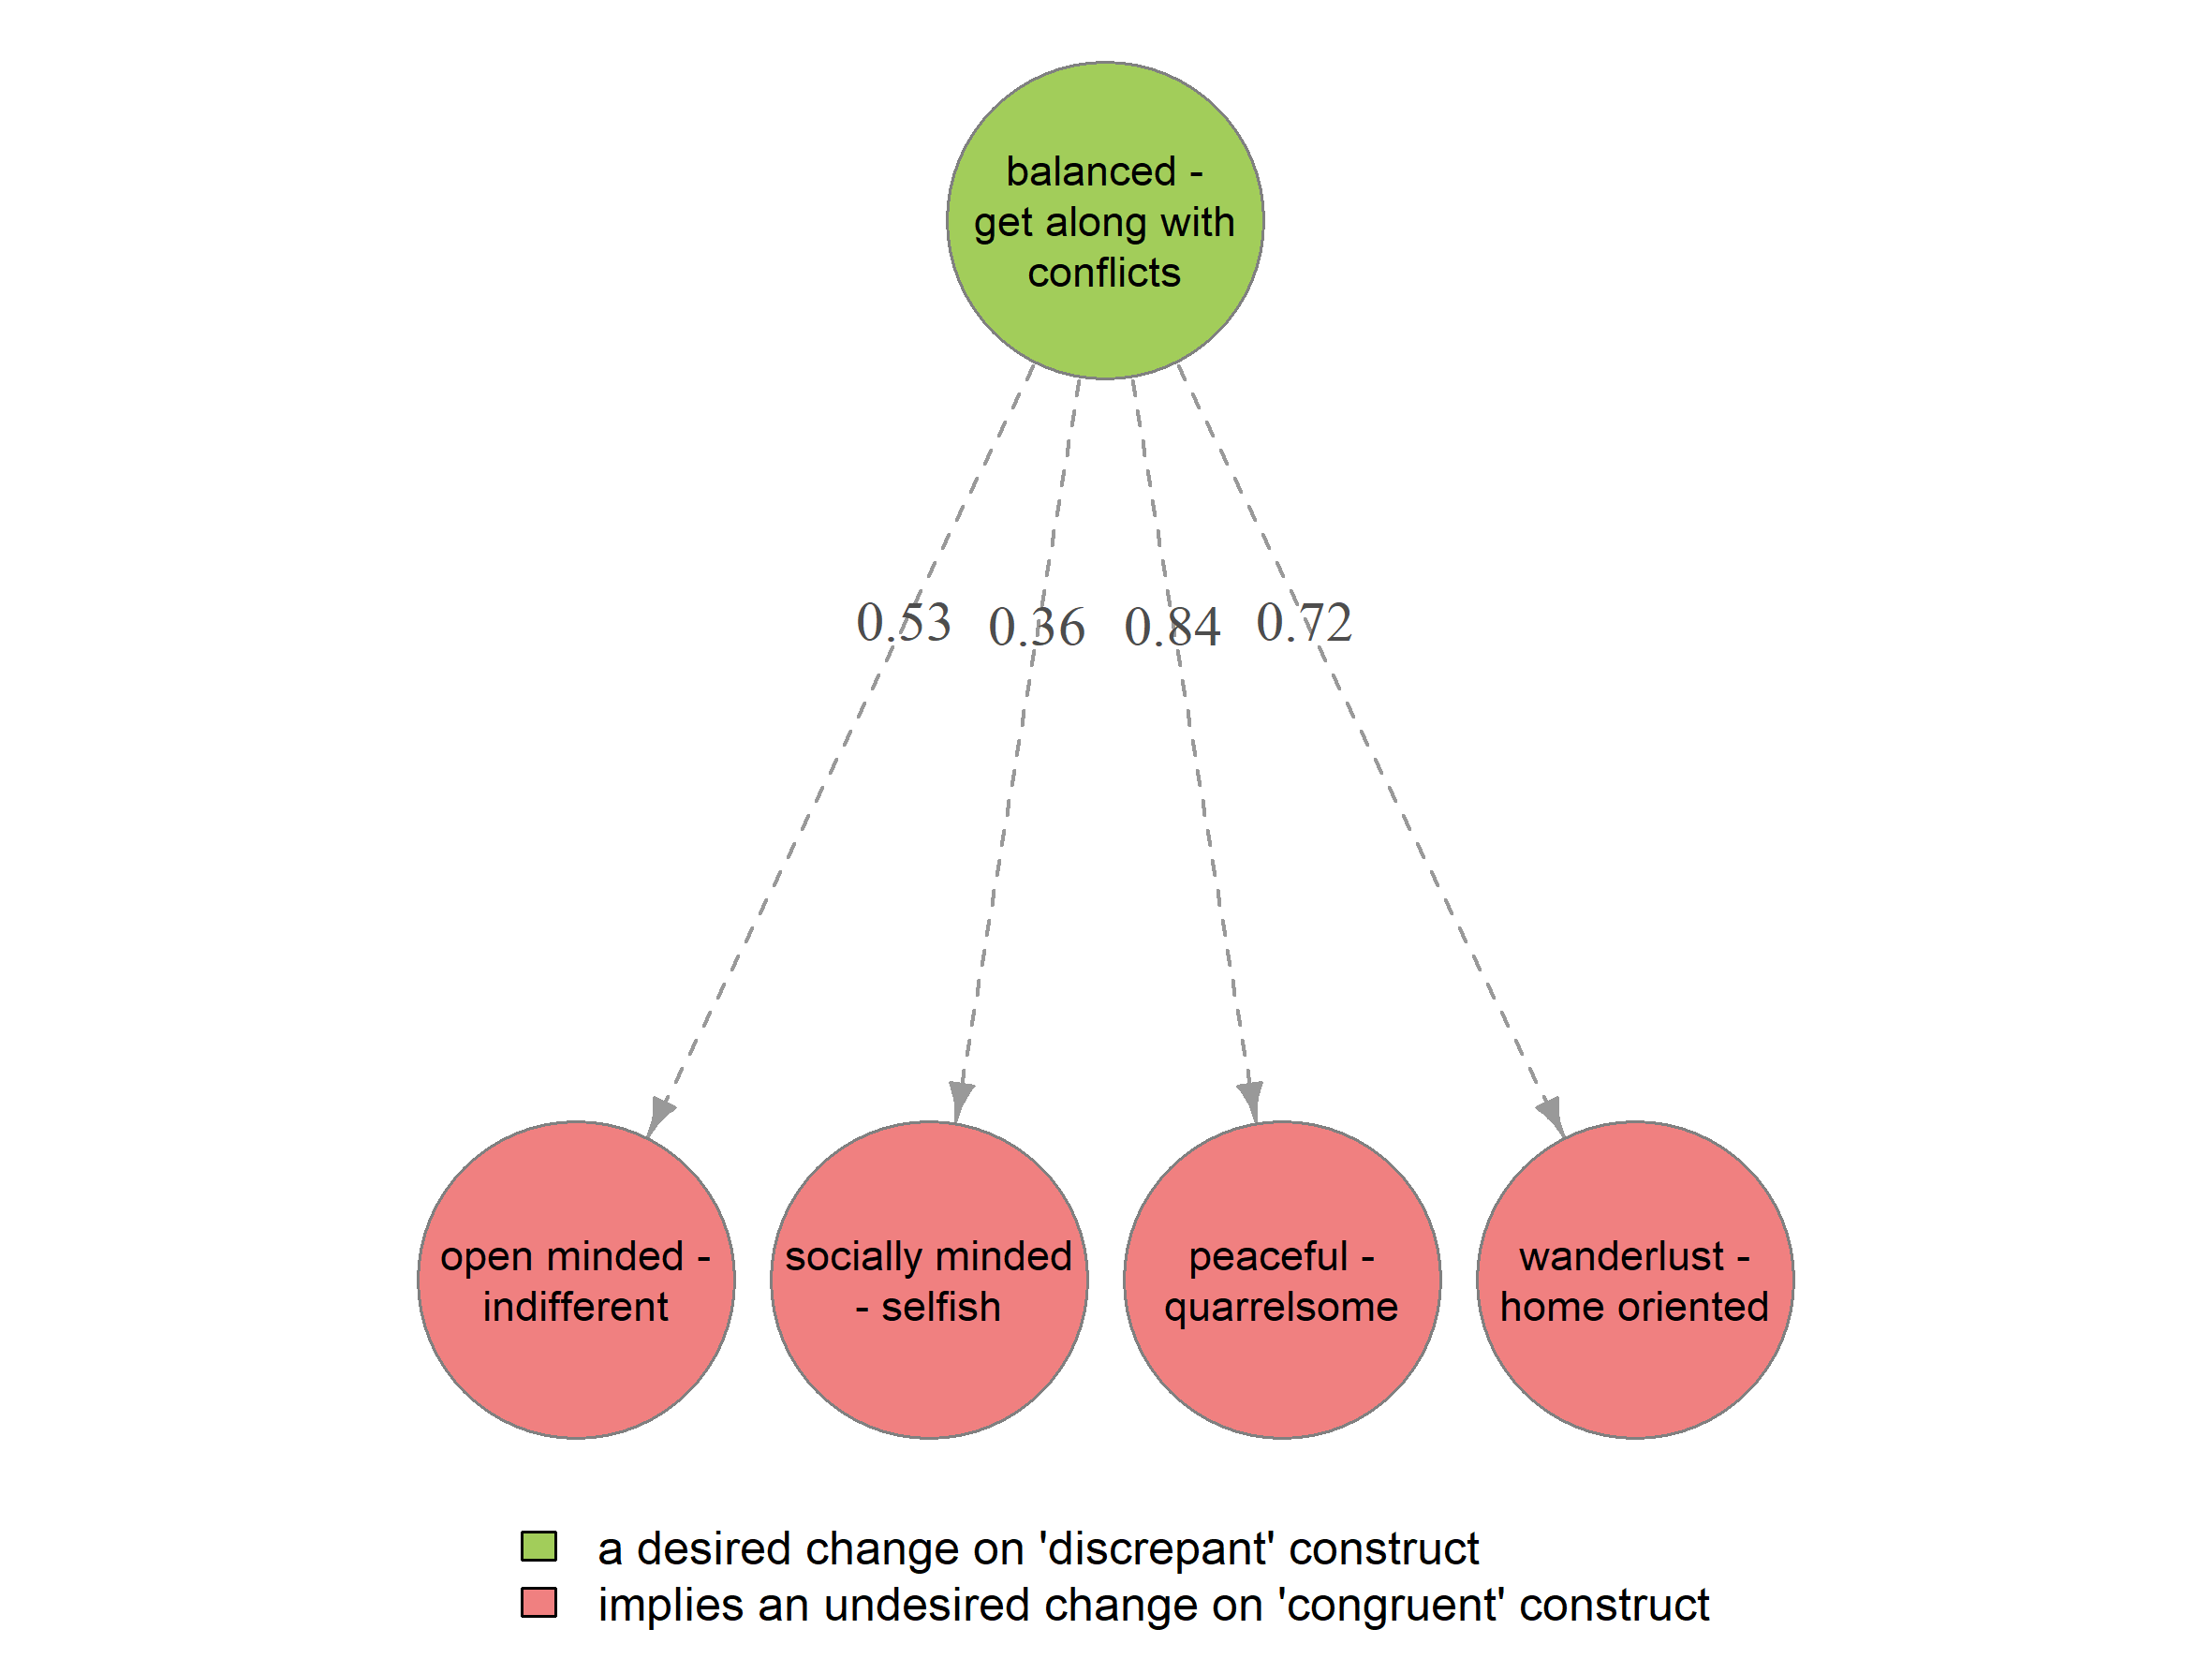
indexDilemma function. For the dataset above, the results
show that a desired change on the discrepant contruct balanced - get
along with conflicts towards the get along with conflicts
pole implies four undesired changes, for example, to become more
indifferent and less peaceful.
id <- indexDilemma(boeker, self = 1, ideal = 2)
id
#
# ####################
# Implicative Dilemmas
# ####################
#
# -------------------------------------------------------------------------------
#
# SUMMARY:
#
# No. of Implicative Dilemmas (IDs): 4
# No. of possible construct pairs: 91
# Percentage of IDs (PID): 4.4% (4/91)
# Intensity of IDs (IID): 61.3
# Proportion of the intensity of constructs of IDs (PICID): 2.7
#
# -------------------------------------------------------------------------------
#
# PARAMETERS:
#
# Self: Element No. 1 = self
# Ideal: Element No. 2 = ideal self
#
# Correlation Criterion: >= 0.35
# Note: Correlation calculated including elements Self & Ideal
#
# Criteria (for construct classification):
# Discrepant if Self-Ideal difference: >= 3
# Congruent if Self-Ideal difference: <= 1
#
# -------------------------------------------------------------------------------
#
# CLASSIFICATION OF CONSTRUCTS:
#
#    Note: Constructs aligned so 'Self' corresponds to left pole
#
#                              Construct Self Ideal Difference Classification
# 1  balanced - get along with conflicts    1     4          3     discrepant
# 2                  isolated - sociable    3     6          3     discrepant
# 3        closely integrated - excluded    2     2          0      congruent
# 4                 passive - discursive    3     6          3     discrepant
# 5            open minded - indifferent    2     1          1      congruent
# 6               dispassionate - dreamy    3     2          1      congruent
# 7     practically oriented - depressed    2     1          1      congruent
# 8                    serious - playful    3     2          1      congruent
# 9            socially minded - selfish    2     1          1      congruent
# 10              peaceful - quarrelsome    2     2          0      congruent
# 11                technical - artistic    2     6          4     discrepant
# 12              scientific - emotional    2     1          1      congruent
# 13               extrovert - introvert    3     2          1      congruent
# 14          wanderlust - home oriented    1     1          0      congruent
#
# -------------------------------------------------------------------------------
#
# IMPLICATIVE DILEMMAS:
#
#    Note: Congruent constructs on the left - Discrepant constructs on the right
#
#                        Congruent                             Discrepant    R            RexSI
# 1   5. open minded - indifferent 1. balanced - get along with conflicts 0.53             0.63
# 2   9. socially minded - selfish 1. balanced - get along with conflicts 0.36             0.43
# 3     10. peaceful - quarrelsome 1. balanced - get along with conflicts 0.84 *Not implemented
# 4 14. wanderlust - home oriented 1. balanced - get along with conflicts 0.72             0.79
#
#   R = Correlation including Self & Ideal
#   RexSI = Correlation excluding Self & Ideal
#   R was used as criterion
The implied dilemmas can also be visualized as a network graph.
Contributing
In order to maximize the package’s usefulness for the grid research community, we welcome participation in the package’s further development. Experienced R programmers are asked to make pull requests to the OpenRepGrid github repository, report issues, or commit code snippets by email. Non-technical oriented researchers without programming knowledge are invited to send us feature requests or suggestions for collaboration, for example, to jointly develop and implement a new repgrid analysis method. The goal is to make OpenRepGrid useful for the majority of the repgrid community which will only be possible via research community participation.